


Comparative analysis of prices for fruit
 |
|  |
| 
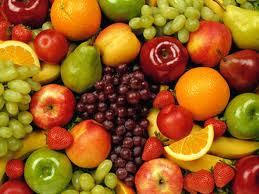
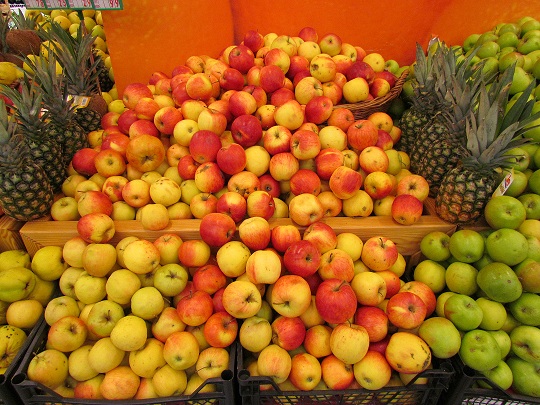
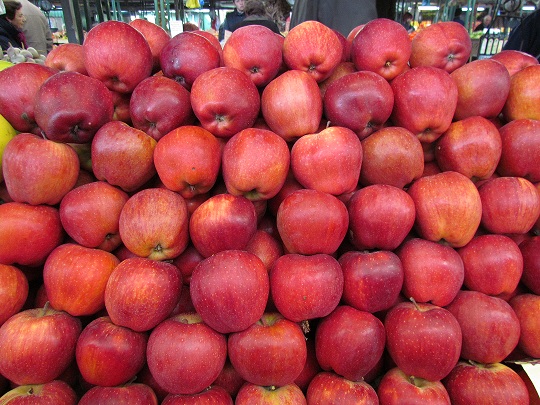
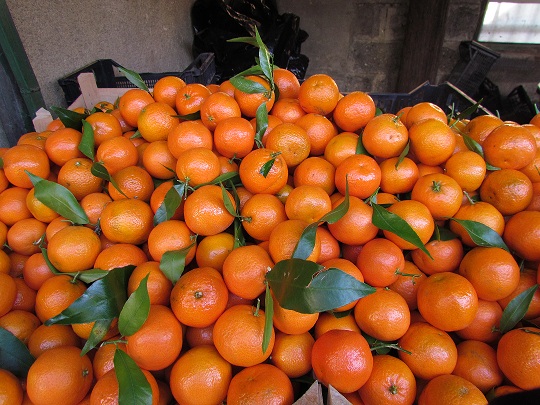
The table shows prices of the most important fruit from Retail Markets-for September 2012 / 2011:
| Fruit | September 2012 | September 2011 | Difference (%) September 2012/2011 |
| White Grapes | 29.78 | 33.5 | -11.1 |
| Black Grapes | 30.34 | 32 | -5.2 |
| Apple-Idared | 38.5 | 33 | 16.7 |
| Apple-Golden Delicious | 33 | 36 | -8.3 |
| Apple-Red Delicious | 37 | 35 | 5.7 |
| Apple - Yonagold | 39.24 | 31.3 | 25.4 |
| Apple - Mutsu | 37.7 | 35 | 7.7 |
| Pomegranate | 34.2 | 40 | -14.5 |
| Pear | 66.2 | 52 | 27.3 |
| Hazelnut - peeled | 540 | 550 | -1.8 |
| Nut - peeled | 470 | 567 | -17.1 |
| Fig | 37.2 | 37 | 0.5 |
| Plum | 26.8 | 26.4 | 1.5 |
| Lemon | 97.5 | 73 | 33.6 |
| Banana | 47.09 | 35.1 | 34.2 |
| Orange | 60 | 66 | -9.1 |
| Kiwi | 86.5 | 113 | -23.5 |
* prices are shown in denars per kilogram
Links
|
|
|
|
|
|
|
|
 |
|
|
|
|
|
|


